Basic Course Items and Foundational Concepts
EDP 611
Overview
You can measure many things Measurement is a principle trait and whether it is hard wired, learned, or some combination of both, its absence makes quantitative data impossible to classify. Even in cases where measures are available, how can we know if they are consistent and accurate? Without these checks, instruments such as surveys could never be constructed, much less yield results that could be generalized.
When assessing existing programs, having an ability to test a hypothesis is key in understanding its goals. While evaluation tells us whether a program is producing results or having an effect/impact, (performance) measurement tells us what a program did and how well it did it. In particular, the latter is a necessity and involves collecting and reporting data that can be used to compartmentalize the way a program is being implemented.
Course Objectives
Assess the credibility and ethics of measurement practices
Confidently determining valid and reliable measures
Interpret and report psychometric properties of tests
Recognize measurement in the evaluative process
Understand the methods and techniques for establishing and evaluating reliability and validity
Helpful References
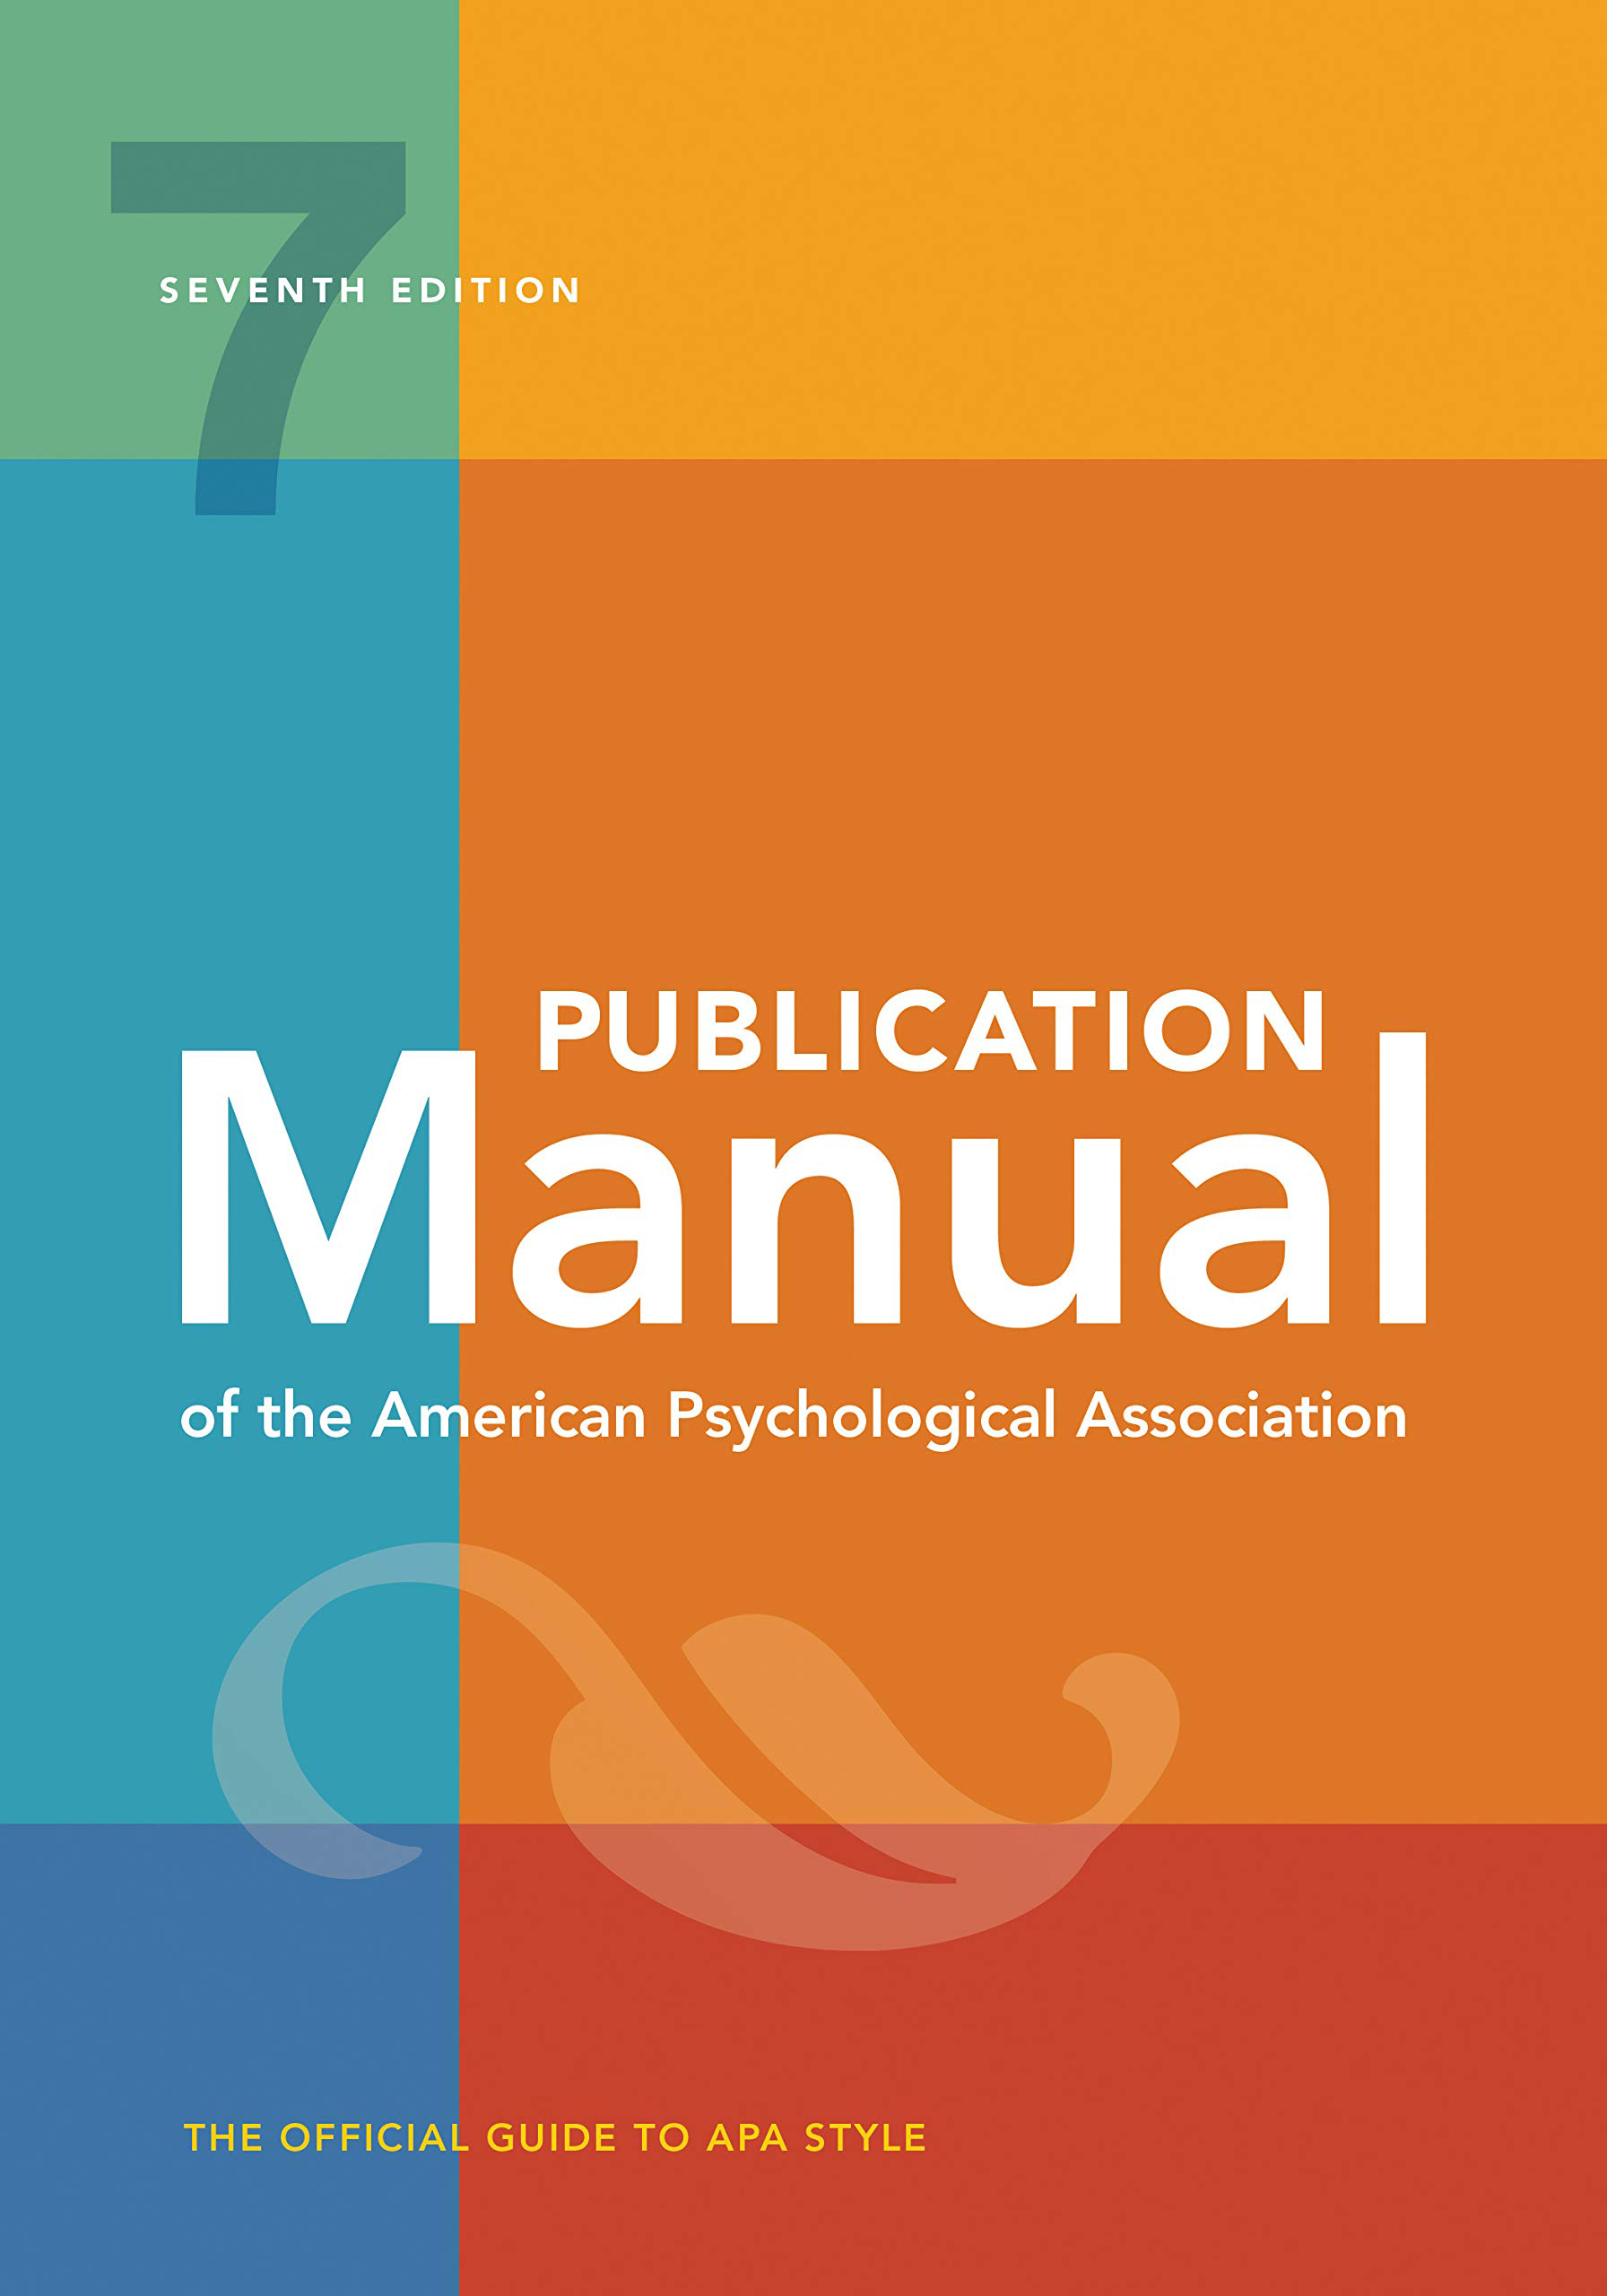
To help minimize costs, there is no formal text. We'll rely on the text below which is available through the WVU library in an online capacity barring the APA 7th edition handbook.
Helpful References
To help minimize costs, there is no formal text. We'll rely on the text below which is available through the WVU library in an online capacity barring the APA 7th edition handbook.
Balkin, R. S., & Kleist, D. M. (2016). Counseling Research: A Practitioner-Scholar Approach. American Counseling Association.
- Free: Digital edition
- Not Free: Softcover edition - ISBN: 9781556203572

Wickham, H., Navarro, D. & Pedersen, T.L. (2021). ggplot2: Elegant Graphics for Data Analysis (2nd and 3rd eds.). Springer.
- Free: Digital edition
- Not Free: Hardcover edition - ISBN: 9783319242750

Wickham, H., Navarro, D. & Pedersen, T.L. (2021). ggplot2: Elegant Graphics for Data Analysis (2nd and 3rd eds.). Springer.
- Free: Digital edition
- Not Free: Hardcover edition - ISBN: 9783319242750

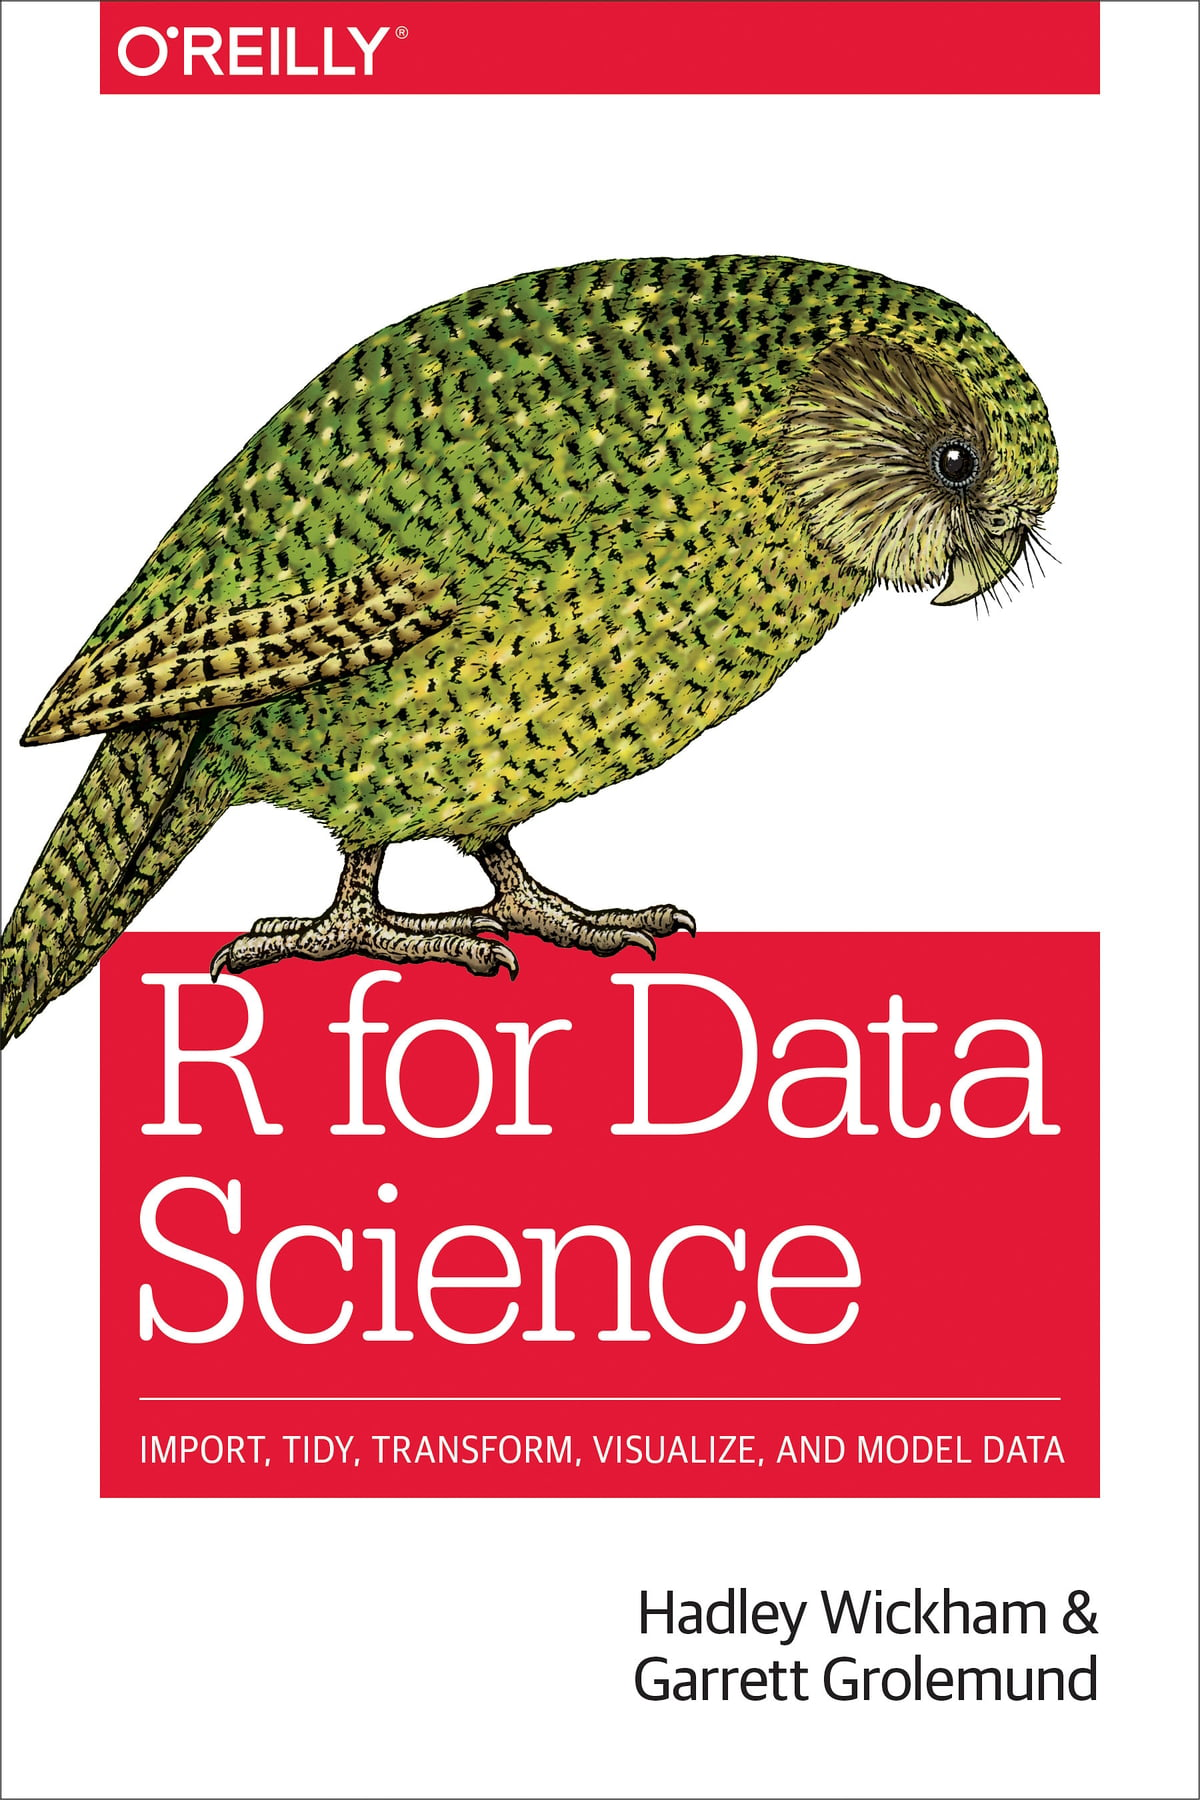
Wickham, H. (2021). R for Data Science (1st ed.). O’Reilly Media.
- Free: Digital edition (web)
- Free: Digital edition (WVU libraries)
- Not Free: Hardcover edition - ISBN: 9781491910399

Assignments and Grades
You can find descriptions for all the assignments on the tasks page.
| Percent | Task | Location |
|---|---|---|
| 15 | R Training | Data Camp |
| 15 | Reflections | Slack |
| 15 | R Measurement EDA | eCampus/Slack |
| 15 | Check-ins | Zoom |
| 30 | Proposal | eCampus/Slack |
| 10 | Elevator Pitch | eCampus/Slack |
The Proposal is scored from a combination of six weekly tasks. The Elevator Pitch and Proposal together is considered to be your final task.
Human Nature v. Science!
Human Nature
Science
- usually observations are inaccurate
- ensure observations are accurate
- generalize from a few cases
- explicitly sample for generalizing
- observe selectively to see what we’re looking for
- consciously decide what and how to observe
- make things up to fulfill gaps
- base conclusions on evidence alone
- get personally and emotionally involved
- respect scientific norms regardless of opinions
- form views with little or no revisions and stick with them
- constantly revise views
- think we can figure out everything
- accept that not everything is knowable


